Quality Assurance Guidelines
- Bug reports
- Types of testing
- Test plans
- Test enviroments
- Browser compatibility
- User account testing
- QA report
- Website Errors
- Screenshots and recording
- iOS and Android Guidelines
- iOS Logs
- Android Logs
- Vocabulary and Terminology
- QA Resources
Bug reports
Bug reports are the cornerstone of Quality Assurance. Their purpose is to provide all the information needed to reproduce and fix an issue found by a QA analyst or engineer. Bug reports should be clear, concise and precise.
Format
We report bugs with the help of different tools, but in most cases the same format can be used. Each bug report should contain:
- Title
- Description
- Reproduction steps
- Expected results
- Actual results
- Environment info (OS, browser, screen size, etc.)
- Screenshot or recording
Here is how a bug report will look like in a Trello ticket:
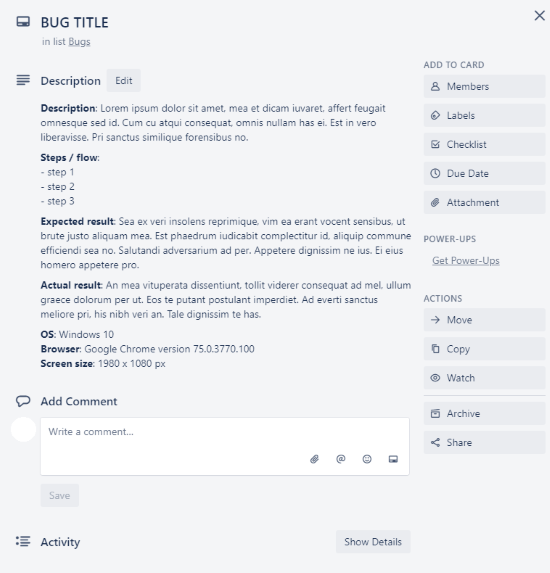
Title
The title is read more often than any other part of the bug report. It should say enough about the bug but still be short. After understanding the bug, others should be able to identify it only by the title.
Description and Reproduction steps
The description helps the developer to understand the bug. It describes the problem encountered. A good bug report should also contain reproduction steps. These steps should be clear and unambiguous actions that lead to the bug.
An example of well-written steps:
- Select product Abc01.
- Click on Add to cart.
- Click remove to remove the product from the cart.
Expected and Actual results
A bug report is incomplete without the Expected and Actual results. Expected results describe how the application should behave when the reproduction steps are carried out. It derives from the product requirements and acceptance criteria. The Actual result describes what actually happens. A deviation between the two results is a bug.
Environment info
The environment information is necessary for a clear bug report. It can be though of as the initial reproduction step. It consists of information about the operating system (type and version), browser (type, version and settings/addons if needed), screen size, mobile device name, application build version, etc.
Screenshot or recording
A picture is worth a thousand words. It is helpfull if the unexpected bug is additionally highlited or marked on the screenshot. In some cases a screenshot is not enough to clearly showcase the bug. In such situations we use screen recording applications to record the bug. The most common formats here are the .mp4 and .gif formats. Video editing software is sometimes also used to help record the bug even more efficiently.
Tips
Here are some useful tips for writing a bug report:
- The title should be short and informative.
- The description should be summarized in minimum words yet in an effective way.
- Writing should be specific and to the point.
- Sentences should be meaningfull and have simple words.
- No steps should be skipped or missed. If the bug is not reproducable it will not get fixed.
- A commanding tone in the report can create an unhealthy work relationship. Use a suggestive tone instead.
- Always check, never assume.
- The problem should be reported immediately. The chance of missing an important step is higher later on.
- The bug should be reproduced more than once. It is important to make sure it is easily reproducable.
Add Bug Report Template to JIRA Fields
To make life easier and absolve repetition of writing Steps, Expected results, Actual results by hand, add these texts as pre-filled in the Description field on Bug issue types in JIRA.
A prerequisite for this is that you’re a workspace admin and have permissions to access project settings.
Steps:
- Login to JIRA and navigate to settings in the top right corner next to the profile picture
- From settings select, under JIRA settings, Projects
- This should navigate you to the Manage projects tab of project settings
- For the correct project, select the three dots on the far right; when the little modal opens, select Project settings
- On the left sidebar, select Issue types
- Choose Bug in the left sidebar as issue type
- This opens up a configuration screen where you can modify which fields are included in the issue type. For now, we want only to add our template to the Description field
- Open the description field under Description fields
- In the blank field, input your desired template, ex.:
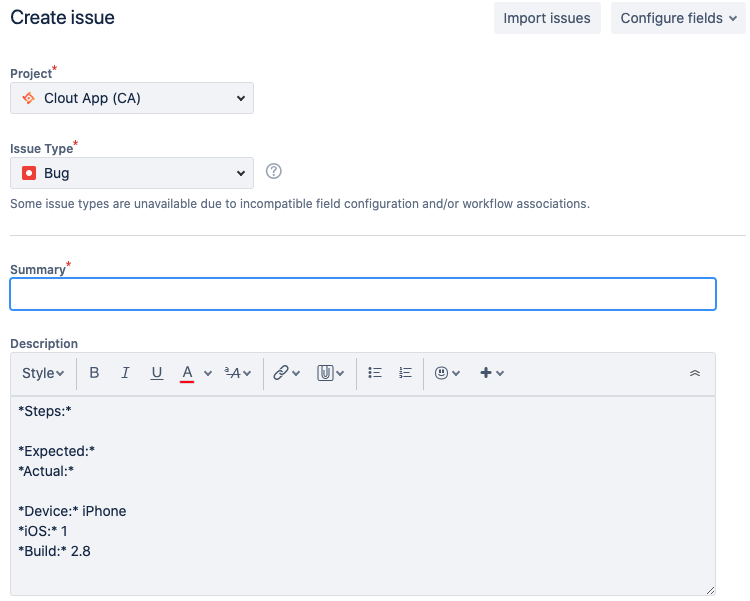
- Optional: make them bold for extra visibility and for those good formatting feels (* Bold syntax *)
- Scroll down to the bottom and Save changes
- Go to project board and create a new bug issue type and check if it opens with pre-filled template we added.
- Congrats, you’ve saved a little bit of future time and have become a top-notch JIRA wizkid!
Types of testing
There are different types of QA work on projects. Usually, you will be doing more than one type of work on a project.
Exploratory testing
This is testing the project and playing around to see if there is any weird behavior that has not been found yet. This can also include stress testing. Exploratory testing is useful when there is no specification of the project and we need to make test scenarios, especially if there is also some old codebase and we need to recheck if functionalities work as intended.
UI testing
With UI testing you should focus mostly on product designs. We aim to ensure that the UI looks like and functions as expected. This can include animations, transitions, different UI states and also colors, fonts, buttons etc.
Feature testing
When testing features, you wish to ensure that all requested functionalities work as expected. Sometimes you’ll have user stories to go by or acceptance criteria on a task.
Regression testing
Regression testing ensures that previously developed and tested features still work the same way after new features are added. This is usually done with the help of a test plan. It contains core features or user stories of the product that should be tested regularly. We usually test products using test scenarios periodically (for example once per month) or before each major release. Usually we don’t create test scenarios for shorter and simpler products.
Retesting
Retesting is diferent from Regression testing. It is done to make sure that the tests cases which failed in last execution are passing after the bugs that were found and reported are fixed.
Reproducing bugs
This testing is reproducing bugs that others (PM, client, dev etc.) have reported. If the initial report is well structured and can be reproduced, no further action is needed. Otherwise, the report is changed and improved to abide by our reporting standards.
Stress testing
Stress testing is a form of deliberately intense testing used to determine the stability of a given system or entity. It involves testing beyond normal operational capacity, often to a breaking point, in order to observe the results. A system stress test refers to tests that put a greater emphasis on robustness, availability, and error handling under a heavy load, rather than on what would be considered correct behavior under normal circumstances. The aim is to ensure the product does not crash in conditions of insufficient computational resources (such as memory or disk space), unusually high concurrency, or denial of service attacks.
Black box testing
Black box testing is the software testing method which is used to test the software without knowing the internal structure of the code or program. This testing is usually done to check the functionality of an application. Black box testing may be executed manually or with automation. Because one of the desired outcomes of black box testing is to confirm that end users will be able to use the product, one of the advantages of human-executed black box testing is emulating the user experience through testing.
Smoke tests
Smoke Testing is a software testing process that determines whether the deployed software build is stable or not. Smoke testing is a confirmation for the QA team to proceed with further software testing. It consists of a minimal set of tests run on each build to test software functionalities. Smoke testing is also known as “Build Verification Testing” or “Confidence Testing.” Smoke Testing is done whenever new functionalities of the software are developed and integrated with an existing build that is deployed in QA/staging/production environment. The goal of smoke testing is to check whether all critical functionalities are working correctly.
End to End Testing
End To End Testing is a software testing method that validates entire software from starting to the end along with its integration with external interfaces. The purpose of end-to-end testing is to test whole software for dependencies, data integrity and communication with other systems, interfaces and databases to exercise a complete production-like scenario. End To End Testing verifies complete system flow and increases confidence by detecting issues and increasing test coverage of subsystems. Modern software systems are complex and interconnected with multiple subsystems that may differ from current systems. The whole system can collapse by failure of any subsystem that is major risk which can be avoided by End-to-End testing.

Test enviroments
A test environment is a setup of software and hardware for the testing teams to execute test cases. In other words, it supports test execution with hardware, software and network configured. Test bed or test environment is configured as per the need of the Application Under Test. On a few occasions, a test bed could be the combination of the test environment and the test data it operates. An example of test environment can be : -Developers sandbox -Staging -Production.
Usually, only the Staging and Production environments are set up. Staging is a pre-production environment used to execute tests before the new changes will be deployed to production.
Browser compatibility
Browser compatibility testing is performed to check the compatibility of the software application on different browsers like Chrome, Firefox, Internet Explorer, Safari, Opera etc. Usually the latest or two latest versions of the browsers are tested. The scope of the testing also depends on client’s wishes and needs.
The QA team has different iOS and Android devices available for testing and in some cases we also use emulators for testing mobile applications. BrowserStack is used to test websites on different browsers, operating systems, mobile and tablet devices. It can be used also for testing mobile apps.
BrowserStack
BrowserStack is a cloud web and mobile testing platform that provides developers and testers the ability to test their websites and mobile applications across on-demand browsers, operating systems and real mobile devices. They have four primary products- Live, App Live, Automate and App Automate. The platform uses real Android and iOS devices. You can find the most used browsers with its latest and older updates on Windows/Mac/Android/iOS, also you can choose a variety of OS-s and mobile devices based on your needs, which gives you easier compatibility testing without losing time installing/uninstalling browsers around your environment.
Cross-platform testing is a very important phase of quality assurance. When a product is developed for multiple platforms, the choice of platforms is endless. Cross-platform testing is performed to determine the behavior of your application and website in different environments, e.g. Web to web, web to ios, web to android, ios to android and vice versa.
Cross-platform testing can be tricky to perform if you don’t plan it beforehand. Apart from that, if the requirements for cross-platform functioning are not communicated to the developer and testers clearly, it may lead to product failure as the product might be good for only one platform or configuration.
User account testing
A lot of times, real applications have options for different user accounts. It is important that these are identified and distinguished. They vary from product to product. Some exapmles are here:
- basic account
- membership account
- manager account
- administrator account
- legacy account
- free account
- paying account
- teacher account
- student account
- etc.
Testing with different user accounts is important especially when these users have different levels of permission. The QA team member should test the application using different accounts.
For creating several different accounts, the QA team can use some tricks.
Email tricks
A nice way to create different Gmail addresses with nothing but a syntax trick is to add a plus sign at the end of the username (before the @). Doing this lets the user add other words to the address, so it looks quite different.
Examples of adding the plus sign in Gmail addresses:
- user+test@gmail.com
- user+poviolabs@gmail.com
- user+qa@gmail.com
- user+qateam@gmail.com
Gmail also ignores periods in addresses, so the user can put a dot anywhere in the email, and Gmail will pretend it doesn’t exist. Websites and application usually do not ignore periods, which means it is possible to sign up for multiple accounts on the same website without needing multiple email accounts.
Examples of period placemenet in Gmail addresses:
- us.er@gmail.com
- u.ser@gmail.com
Both of these methods also work for @poviolabs.com emails.
Note: Some websites recognize these tricks and will not allow making more than one account using the same email address, even when using the plus or period tweak. However, for most websites, this works.
Test plans
QA team created a template for test plans, appropriate for longer, ongoing projects.
Test plans include:
- test suite/functionality
- test case
- priority of test case
- test steps for test case
- expected result after each test case
- actual result after each test case
Test suite/functionality
This part of the test plan tells us what to test. The test suites are created based on different functionalities or different parts of the software application.
Test case
Test cases are subsets of the test suites and help to keep the test plan organized and easier to read. Each test suite can contain one or more test cases, depending on the software application.
Priority of test case
Priority of a test case tells us how critical a specific test case is to functionality of the software application. It is evaluated with numbers from 1 to 5, where 1 is the least critical and 5 is the most critical. This evaluation is particularly helpful when the QA team is pressed for time.
Test steps
Test steps include any preconditions or inputs required to test a particular test case. They also describe the steps or flow of the testing process for each test case.
Expected result
The expected result explains what the result of a test case should be. If there are functional specifications available then the expected results are based on them. The QA team works together with the developers on this part, to write it as clear and defined as necessary. This also gets updated if new features are added.
Actual result
If there is any kind of deviation from the expected result, it is reported in this section.
Test plan template includes also screen sizes, browsers, OS versions etc., depending on whether we are testing a web app or mobile app.
QA report
QA report can be created if the client wishes a report of what’s been tested and how. We have QA report template with info about the project:
- objective and scope
- methods
- test plan
- results
- conclusion
The goal of report is to inform a client about tested features, test cycles, supported and tested browsers and operating systems etc. QA report can be written by QA team member and project manager.
Website Errors
Sometimes when you try to visit a web page, you are met with an HTTP error message. It is a message from the web server that something went wrong. In some cases it could be a mistake you made, but often, it is the site’s fault.
When reporting these kinds of errors, please attach a screenshot with visible web page and console with the error and timestamp (when the error happened so that it can be checked in the logs)
Each type of error has an HTTP error code dedicated to it. For example, if you try to access a non-existing page on a website, you will be met by the familiar 404 error.
Note that even though you will get an error code, it is not necessarily the correct one. Each code has an assigned meaning but there is not much preventing you from returning an incorrect code from the server. Most of the time, they are used correctly, though.
Most common errors are:
1. HTTP Error 500 (Internal Server Error)
The description of this error pretty much says it all. It is a general-purpose error message for when a web server encounters some form of internal error. For example, the web server could be overloaded and therefore unable to handle requests properly.
The 500 is the most common server error, and like the 400 it’s a generic code that points to an unspecified problem. Whenever a server encounters a difficulty that prevents it from fulfilling a request and the issue is not one described by the other available server codes, the server generates a 500 error. Try reloading the page, clearing the cache, deleting cookies and restarting the browser.
2. HTTP Error 403 (Forbidden)
This error is similar to the 401 error, but note the difference between unauthorized and forbidden. In this case no login opportunity was available. This can happen, for example, if you try to access a (forbidden) directory on a website. Try going to the website’s home page and getting to your desired location from there, checking to see if an account signup is an option.
3. HTTP Error 404 (Not Found)
Most people are bound to recognize this one. A 404 error happens when you try to access a resource on a web server (usually a web page) that does not exist. Some reasons for this happening can for example be a broken link, a mistyped URL, or that the webmaster has moved the requested page somewhere else (or deleted it). To counter the ill effect of broken links, some websites set up custom pages for them
4. HTTP Error 400 (Bad Request)
This is basically an error message from the web server telling you that the application you are using (e.g., your web browser) accessed it incorrectly or that the request was somehow corrupted on the way.
A 400 error can be due to a number of factors, including a bad internet connection, a caching issue, or a browser malfunction. Check your connection and settings, clear your cache, open a different browser, and retry.
5. HTTP Error 401 (Unauthorized)
This error happens when a website visitor tries to access a restricted web page but is not authorized to do so, usually because of a failed login attempt.
6. Error 405 (Method Not Allowe)
The 405 error is less common and less easily defined than some others. Basically, a 405 error means that the server understands what the web browser is asking for, but is refusing to fulfill the request. A 405 error could be the result of an error in the website’s code or a faulty redirect.
7. Error 503 (Service Unavailable)
A 503 error indicates that the web server is unable to process the request. When you get a 503 error, it could mean the server is undergoing maintenance, or is overloaded with requests. The best approach with the 503 error is to try again later.
Screenshots and recording
For a QA analyst it can sometimes be difficult and time consuming to exactly explain a bug. For that purpose we use an array of tools, to either capture or record the screen. There are literally a thousand tools to choose from; browsers extensions, applications, software, for MAC, Windows, Chrome, Firefox etc., but here are some that proved to be useful for quality assurance needs.
Native tools
MacBook
If you’re using the Mojave version of macOS, then you can capture and record your screen with the already built in screenshot toolbar. You can access it by pressing Command + Shift + 5 on your keybord. The tools allow you to record entire screen or just a selected portion. You can also do some basic editing with these tools. If you don’t have Mojave, you can still record video on your Mac screen by using QuickTime which comes free with the computer.
Windows
If you’re a Windows 10 user and your version is updated, then pressing WIN + Shift + S, will open up Screen Sketch. This is a feature that was first introduced in Windows Ink Workspace, but is now a standalone application. It has options for taking fullscreen, window, rectangular, or free form screenshots. The app pushes the screenshot to the Clipboard automatically, from where it can be shared or saved. It provides options to annotate the screenshots. If you’re using earlier version of Windows, you can still use the Snipper app to capture the screen.
iOS
To make a screenshot on iOS devices press and hold the Side button on the right side of your device. Immediately click the Volume up button on the left side, then release the buttons. A thumbnail of your screenshot appears in the lower-left corner of your iPhone
To be able to use Screen Recording in iOS, it needs to be enabled first. To do this, open the “Settings” app, choose “Control Center” and choose “Customize Controls”. Find “Screen Recording” and tap the green (+) plus button to add the screen recorder to Control Center in iOS. The feature is now enabled and you can start using it, by swiping to access Control Center (swipe down from the top-right of the screen on any iPhone or iPad without a Home button, swipe up from bottom of screen on any Home button device), tap the Screen Recording button (it looks like a circle) and a countdown to the start of recording will begin. To stop the recording you have to tap the red button at the top of the screen. The captured screen recording video will appear in the Photos app Camera Roll.
Android
The methods for taking a screenshot on Andoid devices can vary, depending on the brand and the model. However on most devices one of the two situations will work. Either press the Power and Home buttons at the same time or Press and hold the Power and Volume down buttons at the same time. Hold both buttons for a second, until you hear a shutter sound or see a visual indicating a picture has been taken. Some Samsung devices also have a Palm Swipe feature which allows you to take a screenshot by swiping your hand across the screen.
Other applications
There are many applications that enable a Mac user to record the screen, but below are some that proved to be not over complicated, yet effective enough for quality assurance purposes.
CloudApp
Cloudapp is an application available for Windows, Mac and iOS operating systems. It allows the user to capture and share images or videos of the screen. It also has options for saving the recordings in gif format and adding annotations to the files. Since it’s a cloud platform, everything you record, you can save in a secure location, that can then be accessed through mobile or desktop apps and is protected by password. This enables very easy sharing of the files via link.
Monosnap
Similar as Cloudapp, Monosnap application can do the usual tricks of capturing an area, a window, or full screen. It is however available only for either Windows or Mac operating system. After capturing an image, it’s then opened in an editor, with different options for annotations. The files can then be either saved on the device or uploaded to the user’s Monosnap web storage. All the files in the storage can be shared via link.
LightShot
Lightshot is an application supported by Windows, MaC, Android and iOS operating systems. It can be used for capturing either a full, or a selected area of the screen. It does not have a feature for recording, but the user can save the files to a cloud and use a link for sharing. There is also an in-app annotation editor for the captured images.
AZ Screen Recorder
AZ Screen Recorder is a screencasting tool for the Android OS platform. Through a simple pop-up bubble that appears on screen, you can snap a screenshot or record a video. It has an option for creating GIF’s and an editor for adding annotations on top of the files.
Sharing files
From iOS to MacOS
With AirDrop, you can wirelessly send different files to a nearby iPhone, iPad, iPod touch, or Mac. The app is installed in all Mac/MacBook/iPhone/iPad you just have to enable it on your laptop/desktop and indicate who you open access to (contacts, everyone etc.). For enabling choose Go > AirDrop from the menu bar in the Finder or select AirDrop in the sidebar of a Finder window. The AirDrop window shows nearby AirDrop users. Just drag one or more documents, photos, or other files to the recipient shown in the window. You can also use : iCloud, Dropbox instead of AirDrop if you have synchronized the saving of your iPhone photos with these tools.
From iOS to Windows
You can download iTools for Windows which is a free alternative to iTunes. With it you can share files from your iOS devices to Windows.
You can also mirror your iOS device on Windows device and record the mirrored screen. All you have to do is download Apowersoft iPhone/iPad recorder for Windows and launch it. On the iOS device’s screen, slide bottom-up to display iPhone options and click on AirPlay. Choose your laptop/desktop and enable the mirror option, then launch the screen recording on your laptop/desktop, and start testing the app on your iOS device.
From Android to Windows
Besides the obvious methods like Bluetooth, cable or USB sharing, there are some applications you can use for sharing files, like AirDroid. It can be used for sharing files or screen mirroring, but before you will need to register an account.
iOS and Android Guidelines
When you test an iOS or Android app, refer to their guidelines. This will ensure that our apps are per their guidelines, will not be rejected, and increase the quality of the apps.
iOS Guidelines: https://developer.apple.com/design/human-interface-guidelines/ios/overview/themes/
Android Guidelines: https://developer.android.com/guide
iOS Logs
To help troubleshoot bugs, devs may need you to submit crash logs from your iOS device.
Directly from the device
Navigate to your device Settings > Privacy > Analytics > Analytics Data.
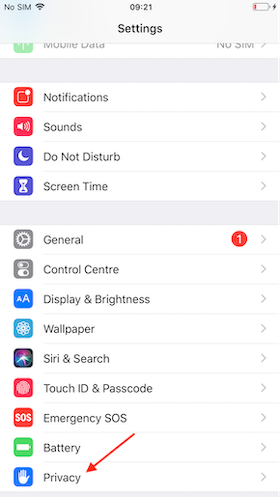
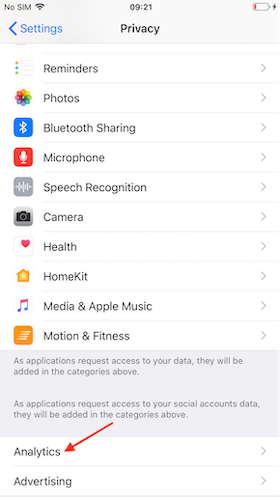
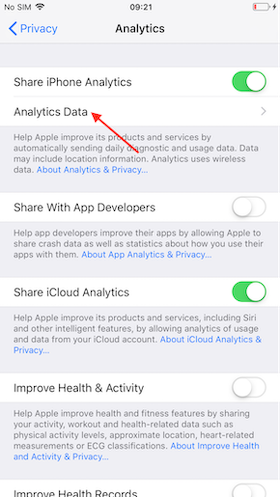
Scroll through this list to find Day One events. See screenshot below. The list is alphabetical.
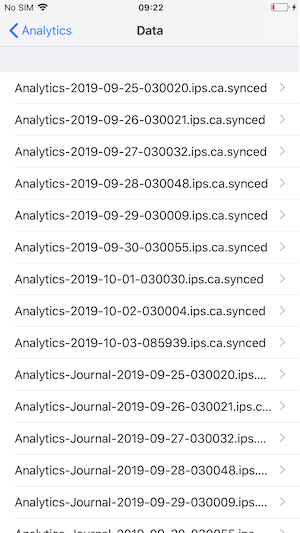
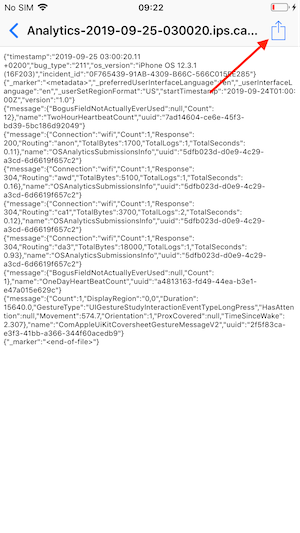
Tap one of these events and then the share icon at the top right.
Using a Mac or PC
Mac Instructions
Follow these steps to get the crash logs:
- Connect your iOS device to your Mac using your iOS connector cable.
- Sync your device.
- Go to the Mac Finder, then choose the “Go” menu’s “Go to Folder” option. (The keyboard shortcut is Command-Shift-G.)
- Copy-and-paste this location into the “Go to Folder” field: ~/Library/Logs/CrashReporter/MobileDevice
- Open the folder corresponding to your device.
- Select the crash logs for your app (appname), then CMD-Click the items to pull up the contextual menu.
PC Instructions
Follow these steps to get the crash logs:
- Connect your iOS device to your PC using your iOS connector cable.
- Sync your device.
- The crash log locations vary based on the version of Windows you’re running:
- Windows XP: C:\Documents and Settings<USERNAME>\Application Data\Apple computer\Logs\CrashReporter<DEVICE NAME>
- Windows Vista & Windows 7: Go to C:\Users<USERNAME> and manually add “AppData” to the folder path: C:\Users<USERNAME>AppData. The complete path is: C:\Users<USERNAME>\AppData\Roaming\Apple computer\Logs\CrashReporter/MobileDevice/
- Windows 8 and later: Make sure that you have hidden files and folders enabled in the Folder Options of the Windows Control Panel, then go to: C:\Users\YourUserID\AppData\Local\Application Data\Apple computer\Logs\CrashReporter<your iPhone’s name>\
- Locate the crash logs. The filenames start with “AppName” and contains a date stamp.
The aditional step (Symbolication)
Please note that this is possible only on Mac computers with Xcode. Before starting the symbolication, keep in mind that some file are necessary in order to fully symbolicate a crash log. The files are:
- Application binary file and dSYM file.
- The binary files and dSYM file for all the frameworks or third party libraries those you have added in the project.
From XCode Window menu, open Devices and choose a Device. Then click on View Device Logs and drag you crash report onto the left column. On behalf of you, XCode will automatically symbolicate the crash file and show the results in the window.
Android Logs
To help troubleshoot bugs, devs may need you to submit crash logs from your Android device.
Gather Device Logs Using Android Studio
The precondition is to install Android Studio. With it, you will also install Android SDK which will help you when using advanced logging with ADB.
- Connect your Android device to your computer over the USB cable
- Open Android Studio
- Click Logcat
- Choose No Filters in the bar on the top right. You will see the Android device logs being gathered
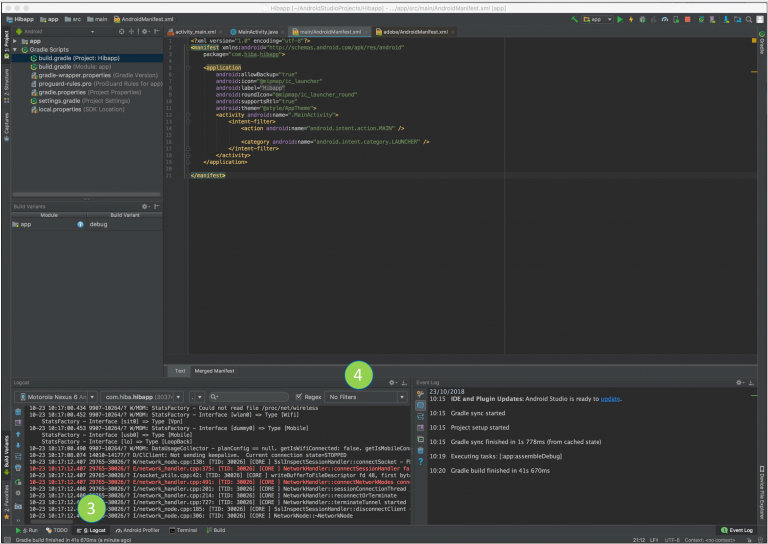
- Highlight the wanted log messages and press Command + C
- Open a text editor and paste all data
- Save this log file as a .log
Gather Android Device Logs using ADB
ADB stands for Android Debug Bridge. It is a tool you can use that allows you to connect an Android device over a USB cable to your computer. With this connection you can uninstall apps, issue shell commands to your device, install apps, and do more with your device. For more information on this look at this: https://developer.android.com/studio/command-line/logcat.html.
Prerequisites for using ADB
In order to use ADB, you’ll need:
- Android SDK. Make sure that platform-tools have included ADB in this package.
- USB driver for the phone
- Android app that has enabled extended logs
To facilitate the usage of ADB, you need to allow USB debugging on your device:
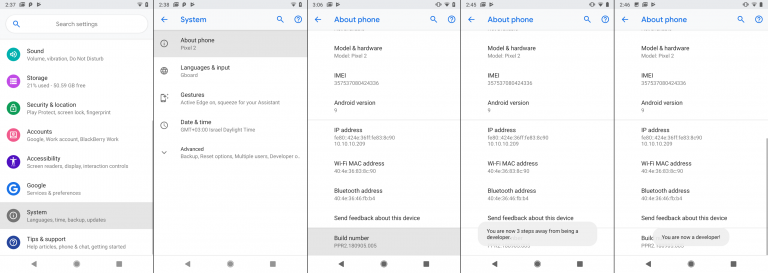
- Enable Developer Options on the Android Device ( https://developer.android.com/studio/debug/dev-options ). Navigate to Settings > About Phone > scroll to the bottom > tap Build number seven (7) times. You’ll get a short pop-up in the lower area of your display saying that you’re now a developer
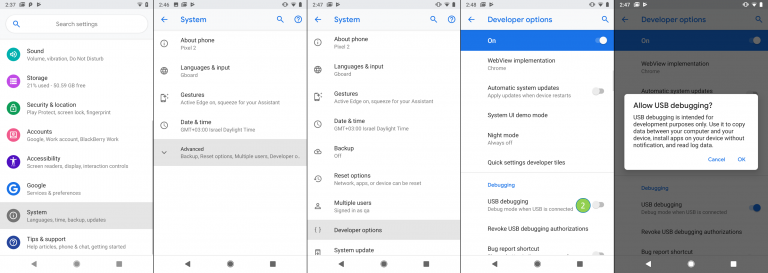
- Navigate to Settings > Advanced > Developer options, check ‘USB debugging’ and click OK on the prompt
-
When the device is connected to the computer, you should be prompted to “Allow USB debugging.” If so, check the Box to “Always allow from this computer“
-
Click OK
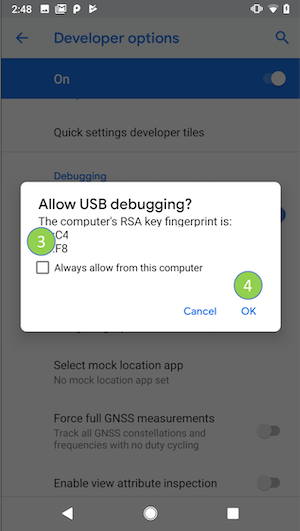
If you do not see the message appear on your mobile device, disconnect and reconnect the USB cable
Gathering Logs
- Connect USB cable to the phone
- Navigate using the terminal to the Android SDK directory (for example C:\Program Files\Android\android-sdk\platform-tools) (search for Android SDK on mac and open it in terminal)
- Type adb logcat
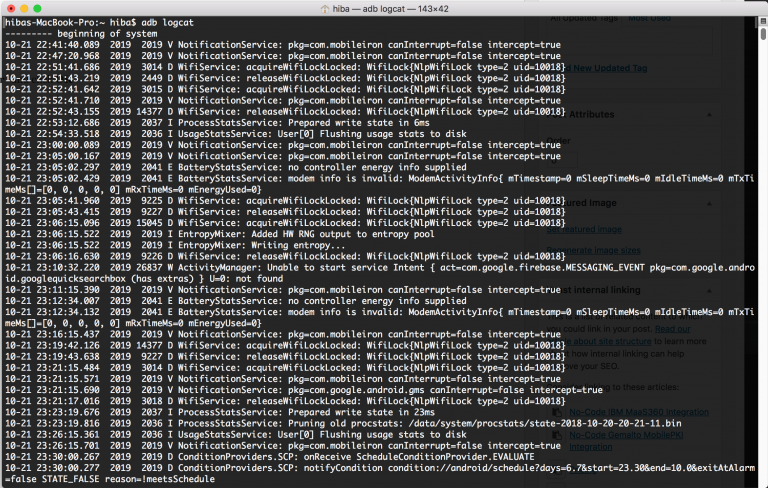
- Reproduce the problem. This will create logs you want to examine.
- If you want to save the output to file, run: adb logcat > /some-folder/android-debug.log
Note! In case your adb version is 1.0.40 and above, and your device is LG:
- Get the device name from “adb devices”
- Run: adb -s
shell -t “logcat”
You can also check the Logging tips.
Vocabulary and Terminology
Testing Terminology
https://reqtest.com/blog/glossary-of-testing-terms/
https://www.mindfulqa.com/qa-vocabulary/
https://www.softwaretestinghelp.com/software-testing-terms-complete-glossary/
Web Design Vocabulary
https://careerfoundry.com/en/blog/web-development/50-web-development-buzzwords-that-all-new-programmers-should-learn/
https://wiredimpact.com/blog/web-design-vocabulary-101/
https://designtlc.com/website-terminology/
https://www.urbanelement.com/insights/the-elements-of-web-design-our-glossary
https://www.w3schools.com/css/default.asp
QA Resources
Disclaimer: A lot of these resources were not quality-checked. Any feedback from those who went through the resources is much appreciated.
Websites
The Testing Show
A podcast about software testing with short episodes every few weeks. It combines news, analysis, audience feedback, and a little silliness, to save you the time and effort of digging through the internet yourself.
Software Testing Subreddit
A subreddit for software testing. It includes threads on all things related to testing (different kinds of tests, test cases, materials, questions about testing, tools etc.).
BBST Course
A free online course with PDFs and videos on various topics that are important for software testers. The website looks awful but it is one of the most recommended courses for black box testing.
MINISTRY OF TESTING: The Dojo
The Dojo provides practical courses using Podcast and Video. Some are free and some are paid.
Software Testing Help
Software Testing help is a popular website focusing on Software Testing and Quality Assurance topics.
Additional: http://www.softwaretestinghelp.com/web-application-testing/ https://www.youtube.com/user/shindevijaykr/playlists
Guru 99
This website covers all needed testing basics in high level and great for beginners.
Additional: https://www.youtube.com/user/guru99com/playlists⠀⠀⠀⠀⠀⠀
Testing Excellence
Testing excellence provides users with information about testing tools, conferences, news as well as other software testing resources.
Tools QA
Articles, more on the humanistic side of understanding QA Testing and development (for example, https://www.toolsqa.com/software-testing/istqb/testers-and-developers-mindsets/)
Testing Plan Template
A template for test plans. The template is quite broad, but it can serve as a kind of checklist to make sure we don’t forget anything when writing out plans.
UX/UI Design
10 USABILITY HEURISTICS
https://medium.com/@erangatl/10-usability-heuristics-explained-caa5903faba2
These are probably the most-used usability heuristics (rules of thumb) for user interface design. It is also good to be aware of them while testing apps.